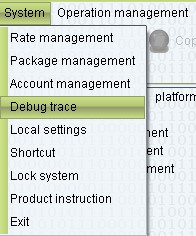
Step 1:Open the “System” > “Debug trace” > Click to open the ‘Softswitch-call’: Trace length defaults is 600 seconds and can be modified as needed. 
PS: Generally we don’t suggest that enable “Debug trace” all the time, it may influence VOS performance.
Click “OK” to operate successfully.
Step 2: Open the “Data query” > “Cdr” 
Click the Filter. You can check the new calls signaling trace after enabling “Debug trace”. Select the cdr which you want to check the call-flow and right click it, then select ‘Call analysis’ to open call-flow. 

Attention matters:
1. Restart the server or Softswitch service may terminate the call-tracking and need to be reset Debug trace.
2. VOS default record up to 16M of the trace data and it can be adjusted in system parameter. 
